Import and signals
Processed Bruker data, ramps, NC_PROC scaling, maxima, broad peaks, regions and attenuations.

DIFFATONCE PRIME
WPF · Windows x64 · 0.14.1A scientific Windows workspace for diffusion NMR: from acquired spectra to attenuation, distributions and traceable reports.
Research version · Existing distribution unchanged · No new public installer
ONE SHARED CONTEXT
General-purpose. Specific calibrations. Traceable decisions.
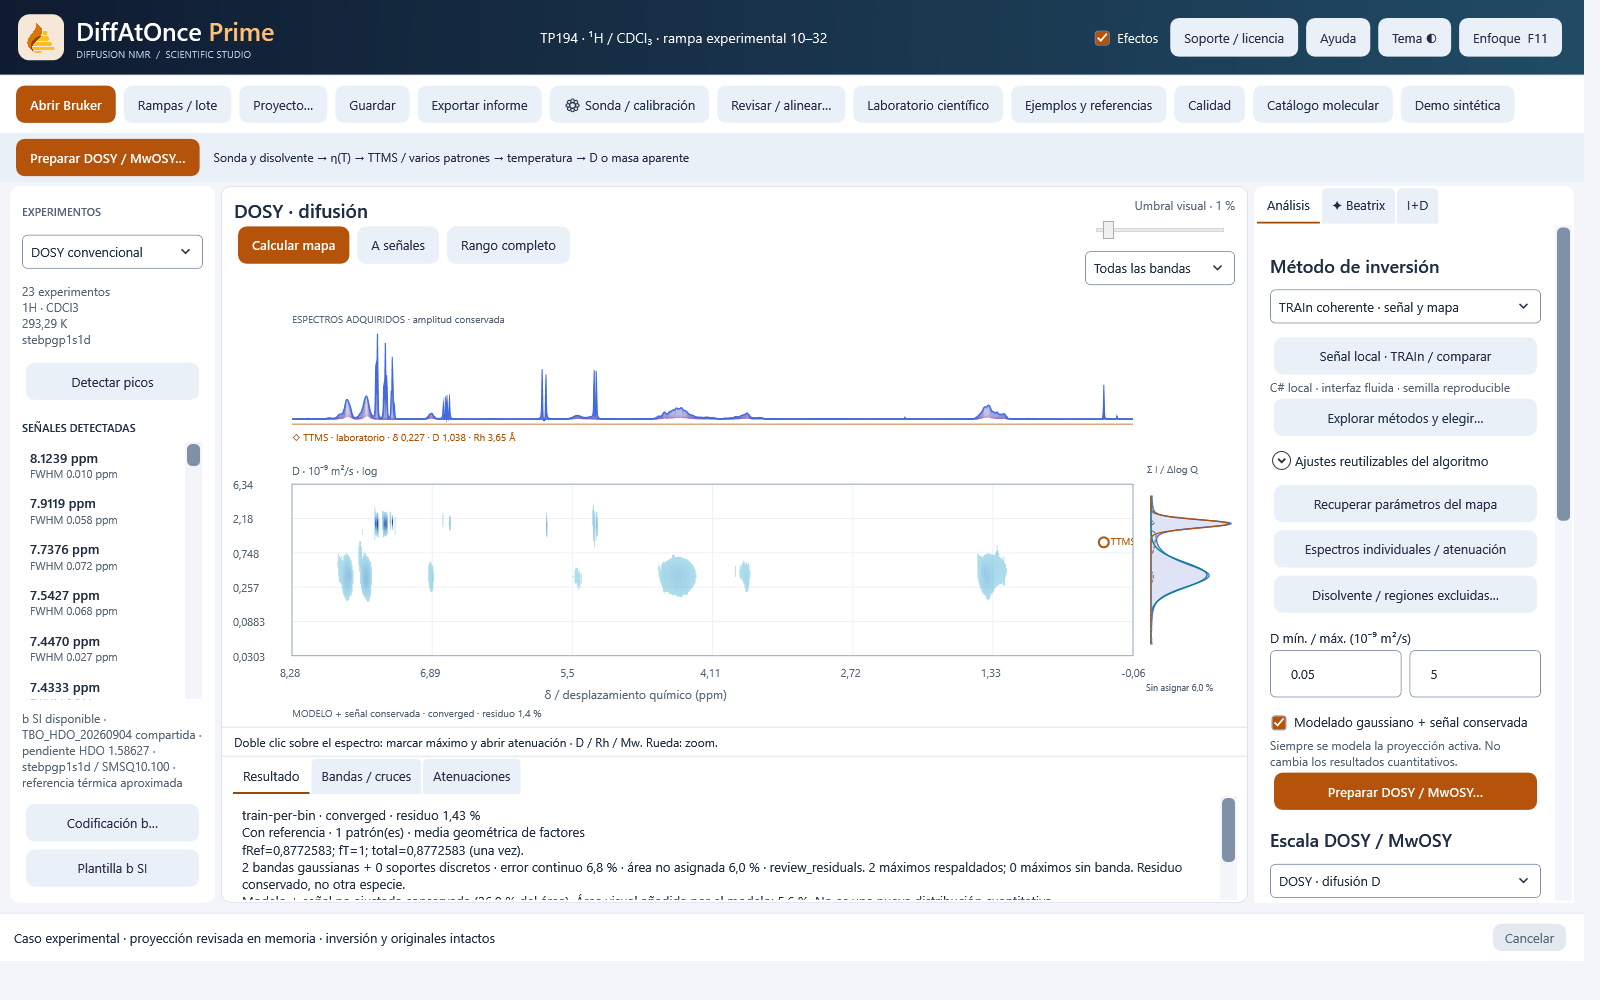
23 experimental TP194 spectra in CDCl₃; ramp 10–32. Saved TRAIn map, TTMS standard and active projection. Residual and status describe this calculation, not universal validation.
Prime 0.12.5 · Actual interface captured on 30 Sep 2026 · TP194 case, 23 experiments · No retouched graphs or generated signals · Spanish application UI; bilingual guide. Context and limits ↓
WORKSPACE
Prime brings together spectral inspection, local calculation, maps and scientific review. Keep your selection while consulting its sources or returning to measured data.
Processed Bruker data, ramps, NC_PROC scaling, maxima, broad peaks, regions and attenuations.
Automatic/manual probe, SI b values, Gmax and known-solute calibration. Zero, one or multiple standards; reviewed temperature and viscosity.
ppm–D or ppm–apparent-mass maps, Gaussian fields with retained signal and active-projection decomposition.
Monoexponential D, ln(I/I₀), 1D distribution, peak/mean D, mean Rh and molecular moments where applicable.
TRAIn, MF-NNLS256, RAI-S, DOME-S, SILT and the local Diffusion-Inversion library. Visible regularisation, residuals and convergence.
Hover cards, pinned context, assignment hypotheses, sources and review. Optional configured local AI or API.
Drift diagnosis, reviewed aligned copies and convection analysis with its own requirements. No silent corrections.
Batches, saved projects, recoverable parameters, DOCX/HTML, CSV, JSON and integrity manifests.
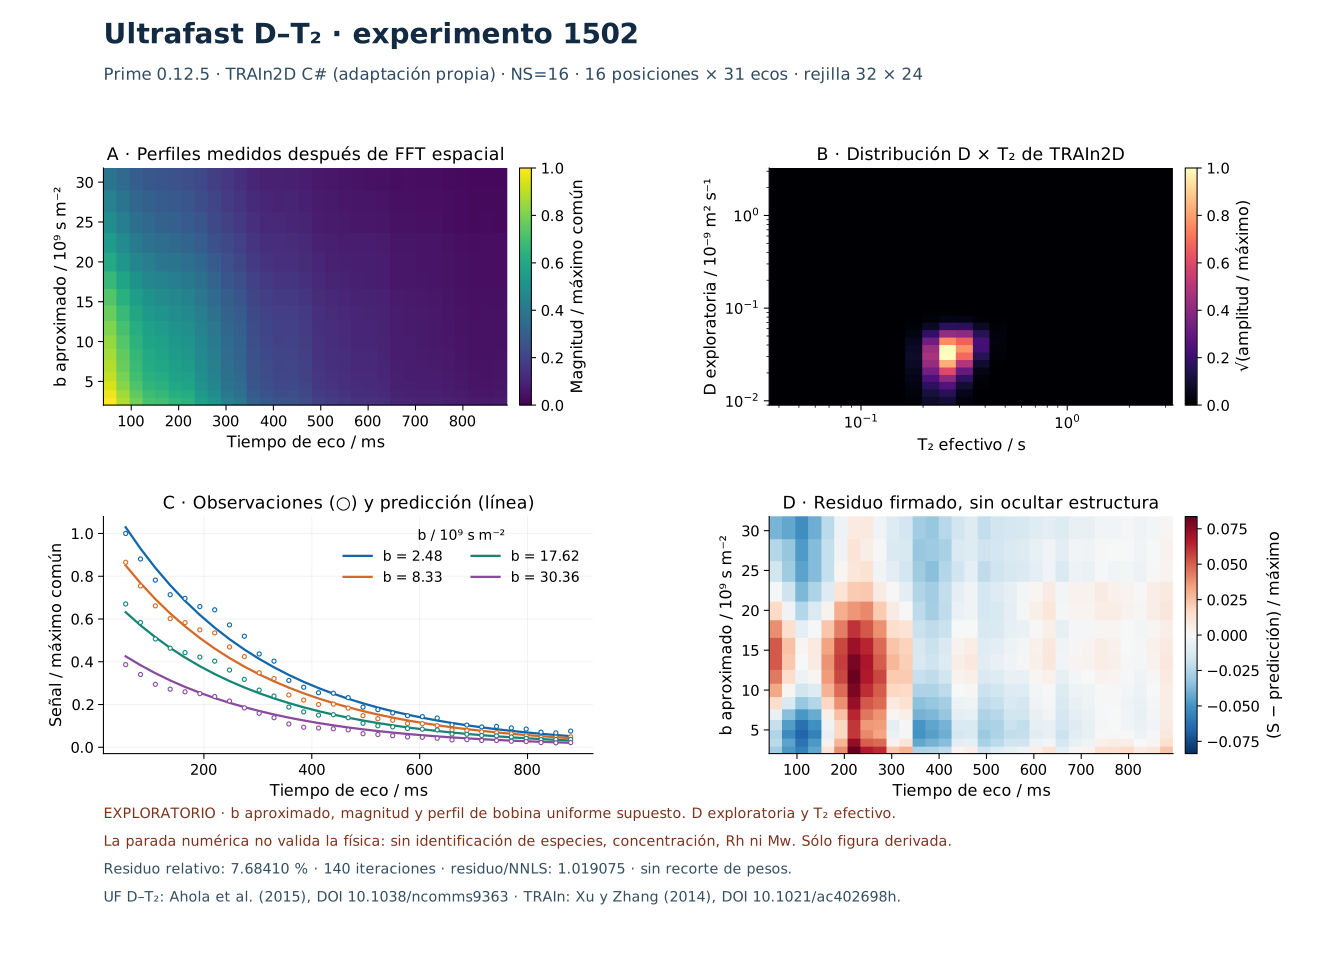
Exploratory reconstruction of example 1502 and 2D inversion using TRAIn2D or FISTA. Visible contract, spatial profile and assumptions; this is not a ppm–D map.
DOSY / MwOSY
Explore a D map, local region or apparent-mass axis. Calibration and active representation stay documented.
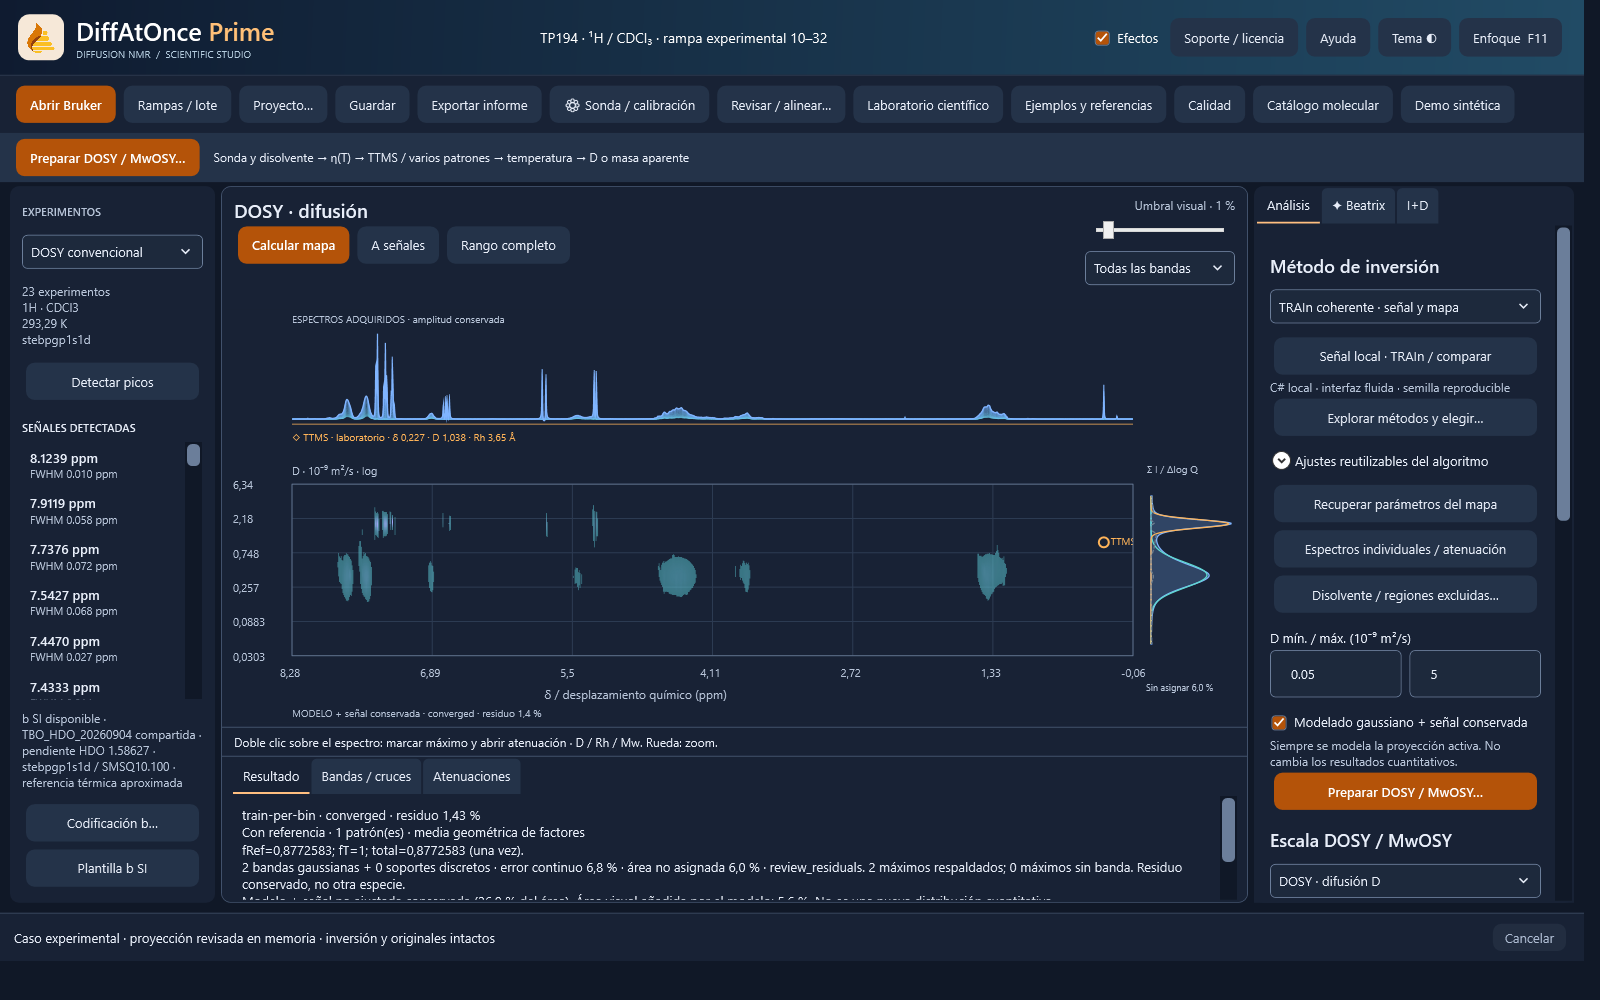
Changing theme does not change intensities, calibration, representation or results.
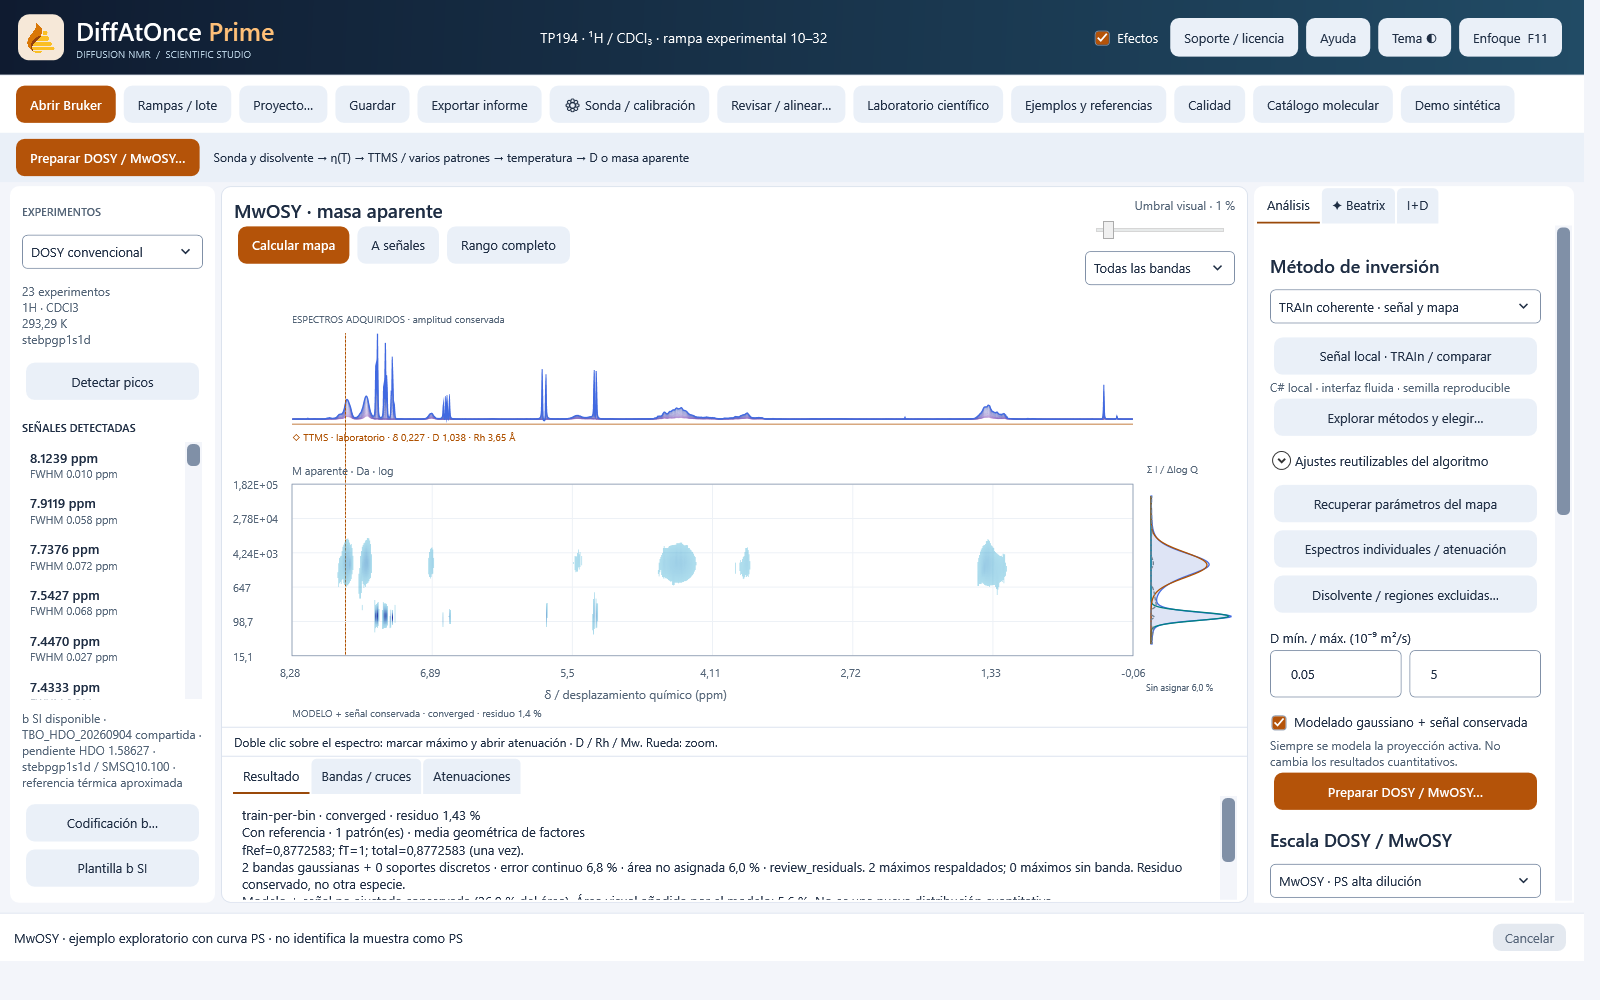
MwOSY view derived from the experimental map with the high-dilution PS curve. An apparent-mass conversion example: it does not identify TP194 as PS or validate its absolute mass. No weighing data were invented.
FROM PEAK TO RESULT
Double-click to mark the local maximum and open attenuation. Compare intensity, ln(I/I₀), distribution and components without confusing a good fit with identification.
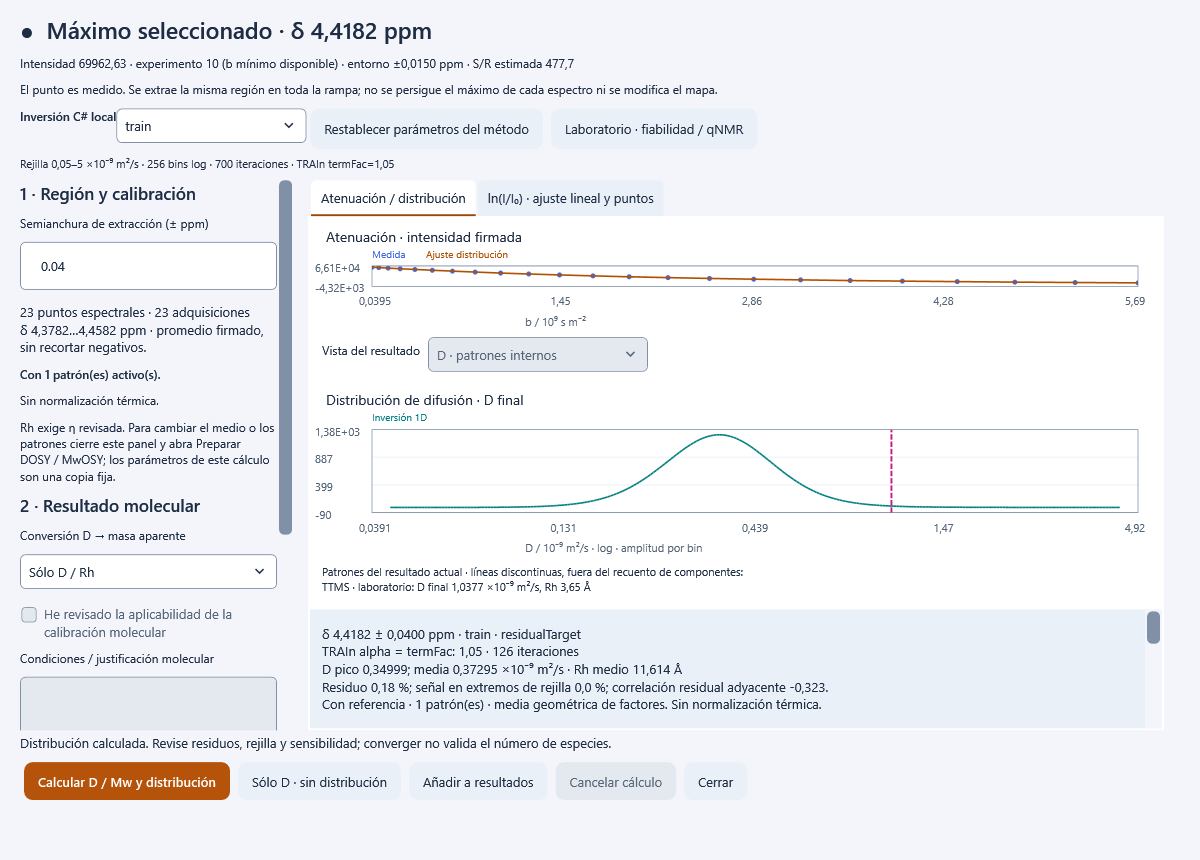
Experimental region centred at 4.4182 ± 0.04 ppm. TRAIn is calculated on original signed data; standards are markers with no area.
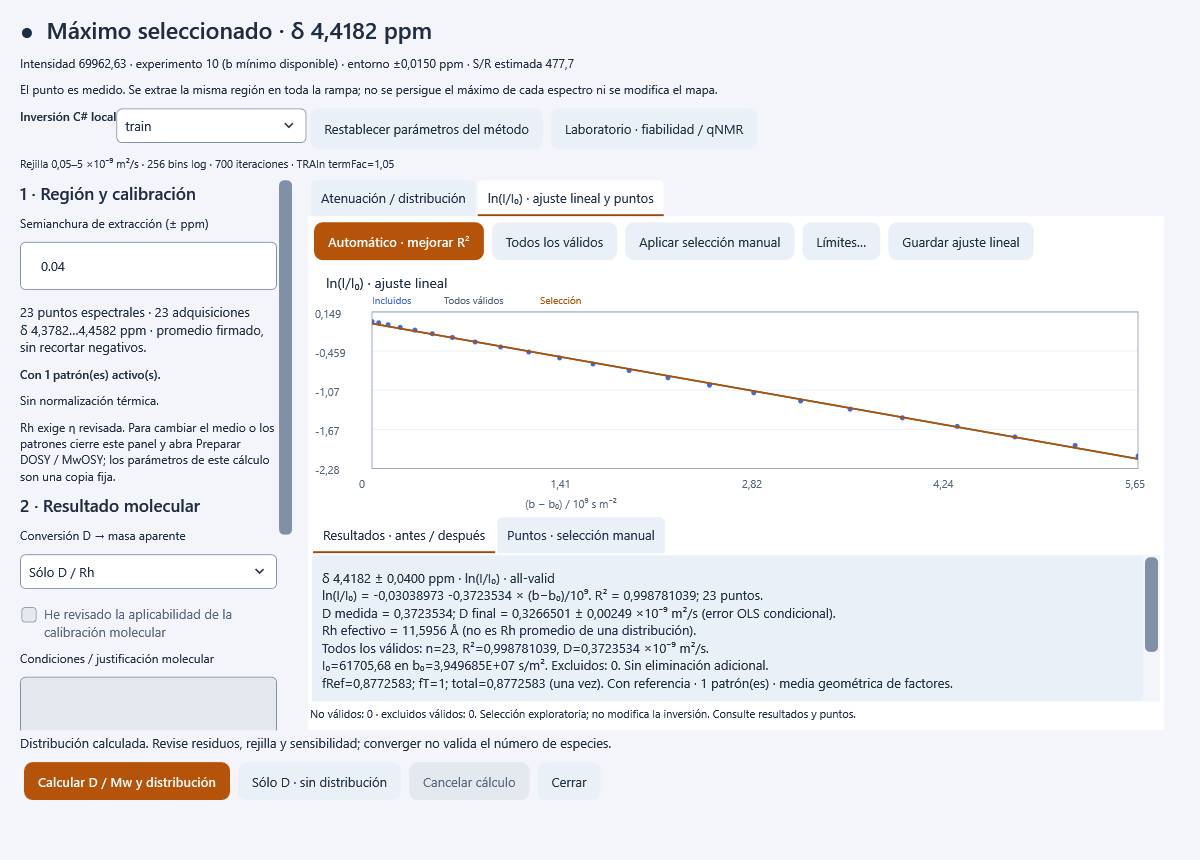
OLS fit to every valid point in the experimental region. I₀ is the positive intensity at the lowest available b.
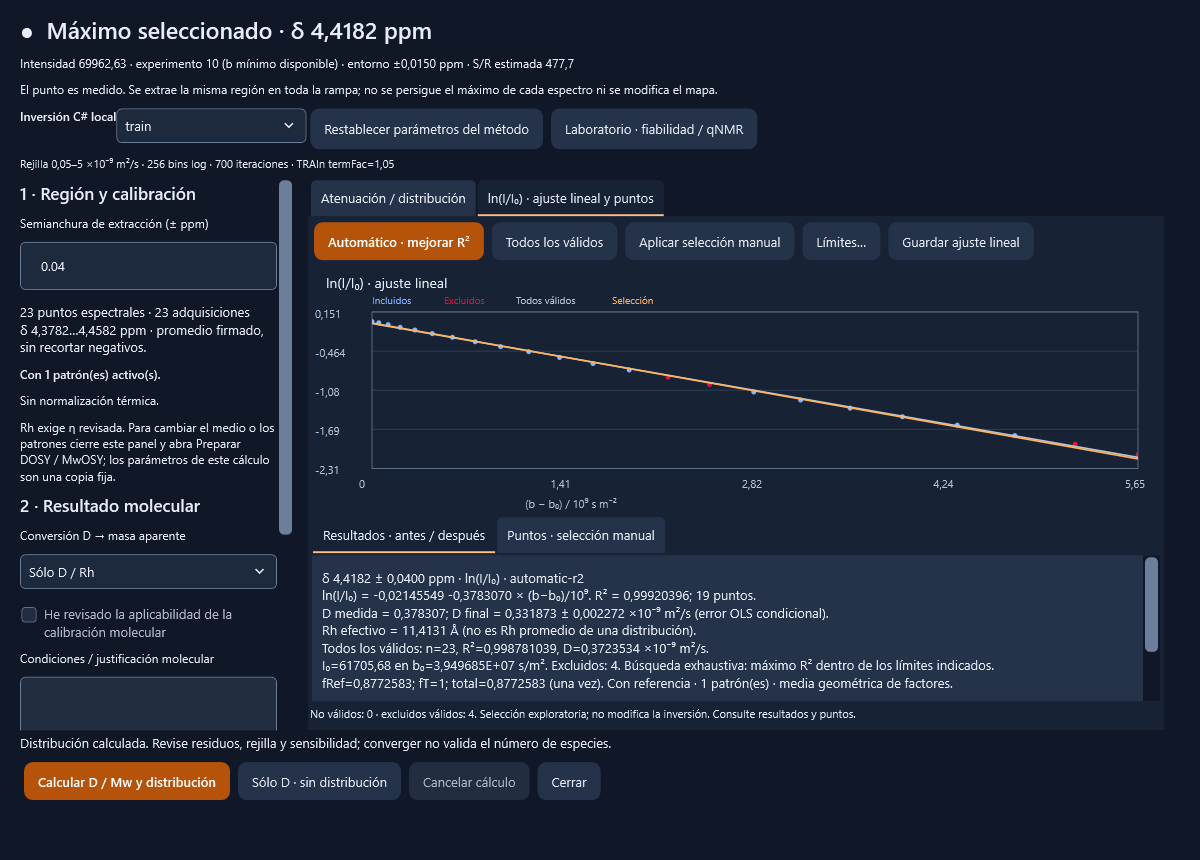
Exploratory R²-based selection. Excluded points remain visible; the mask does not affect inversion or the map. Higher R² does not prove a more accurate D.
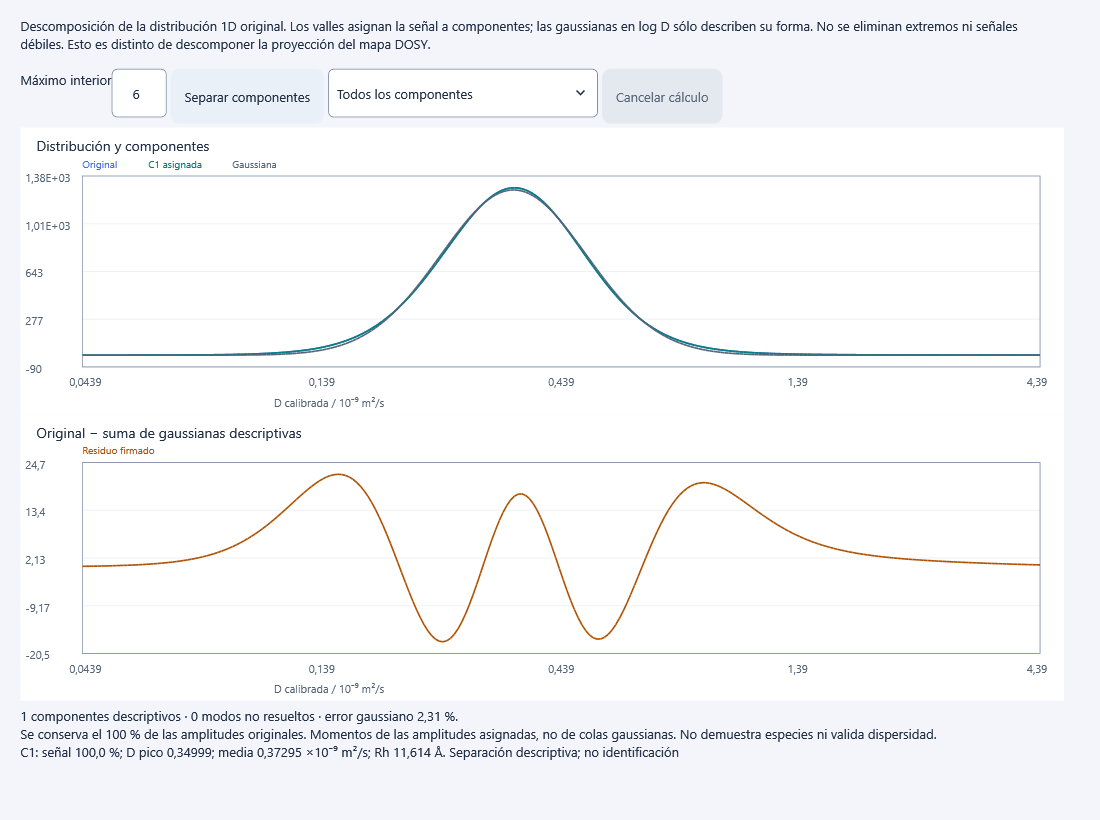
Descriptive separation of the calculated distribution. Moments use assigned bins, not Gaussian tails or identified chemical species.
CALIBRATE WITH CONTEXT
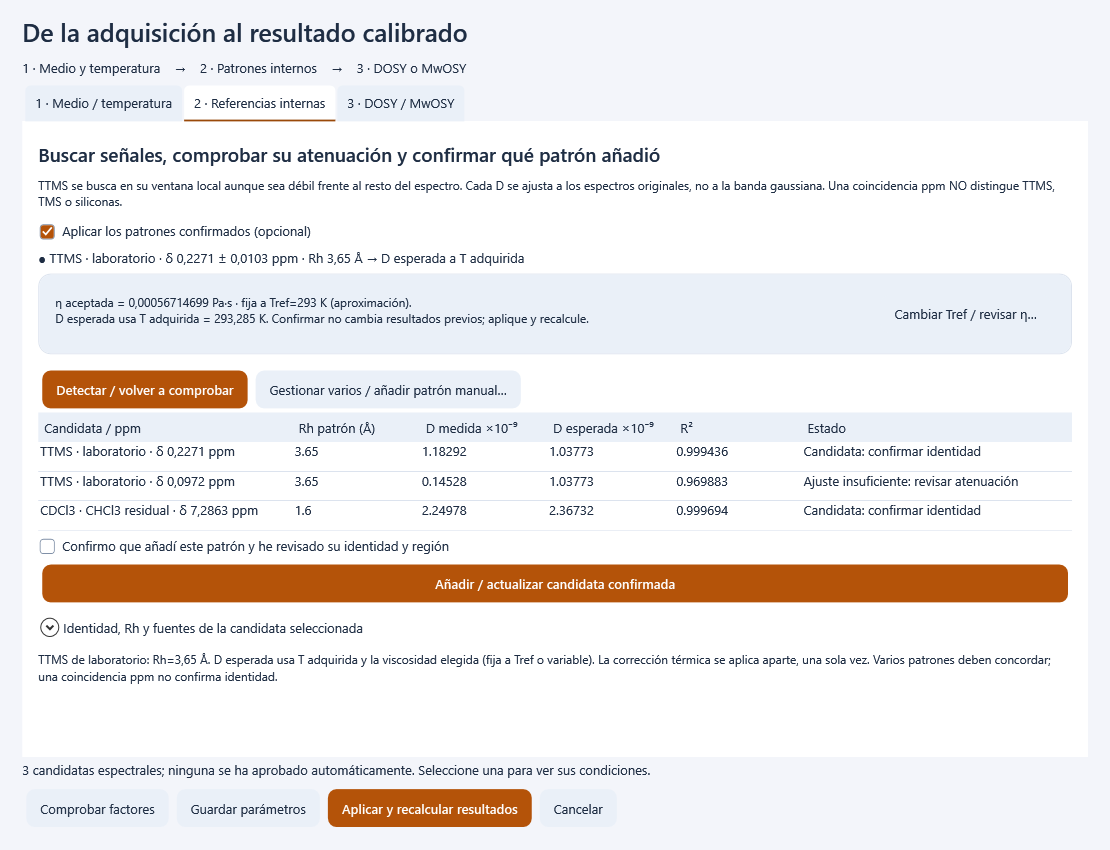
Detection on the real ramp and saved settings. A ppm candidate does not confirm which substance was added.
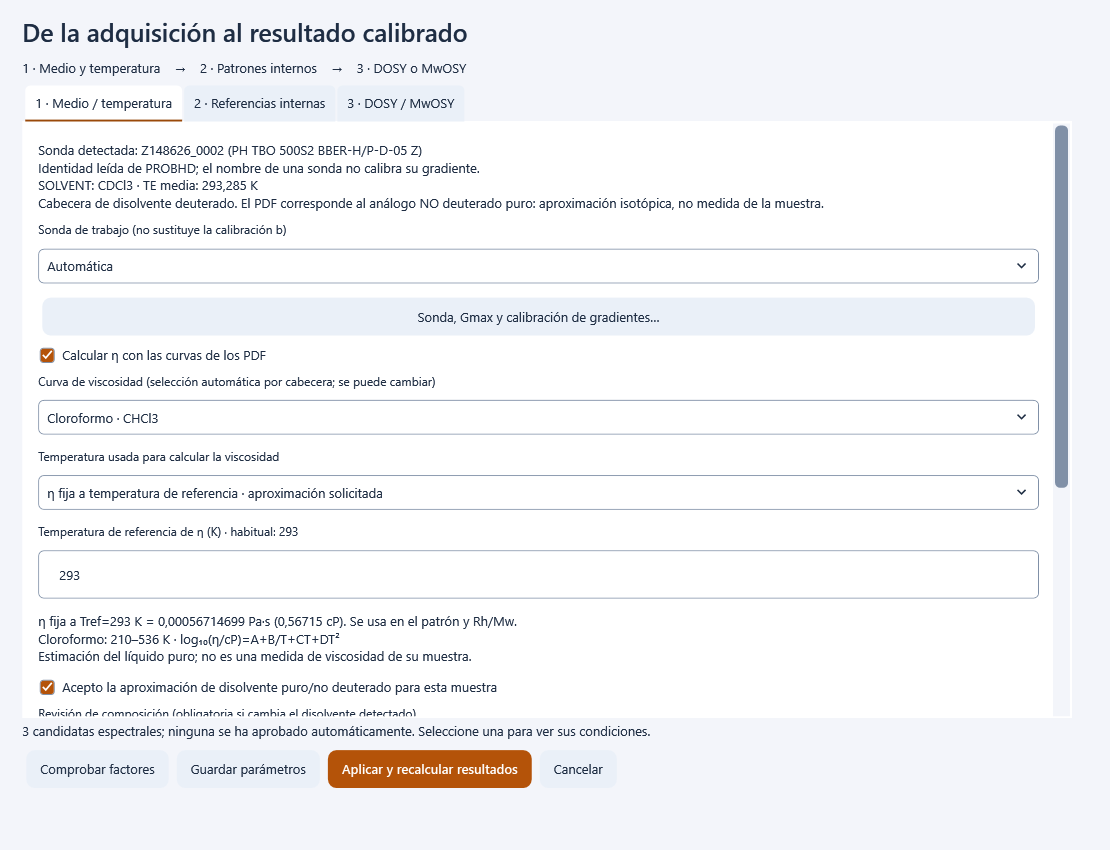
Settings for the real acquisition. Pure-solvent viscosity is a reviewable approximation, not a measurement of the mixture.
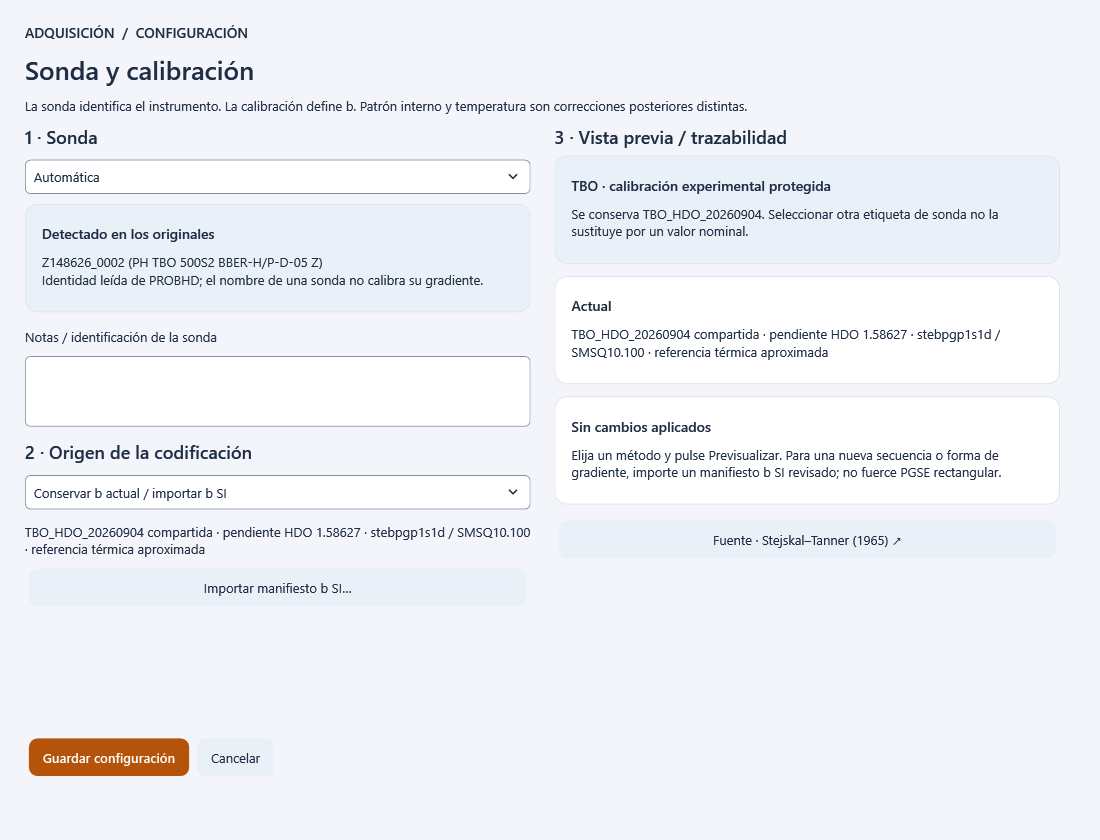
Calibration window for the real case; no changes applied. A probe label does not determine Gmax.
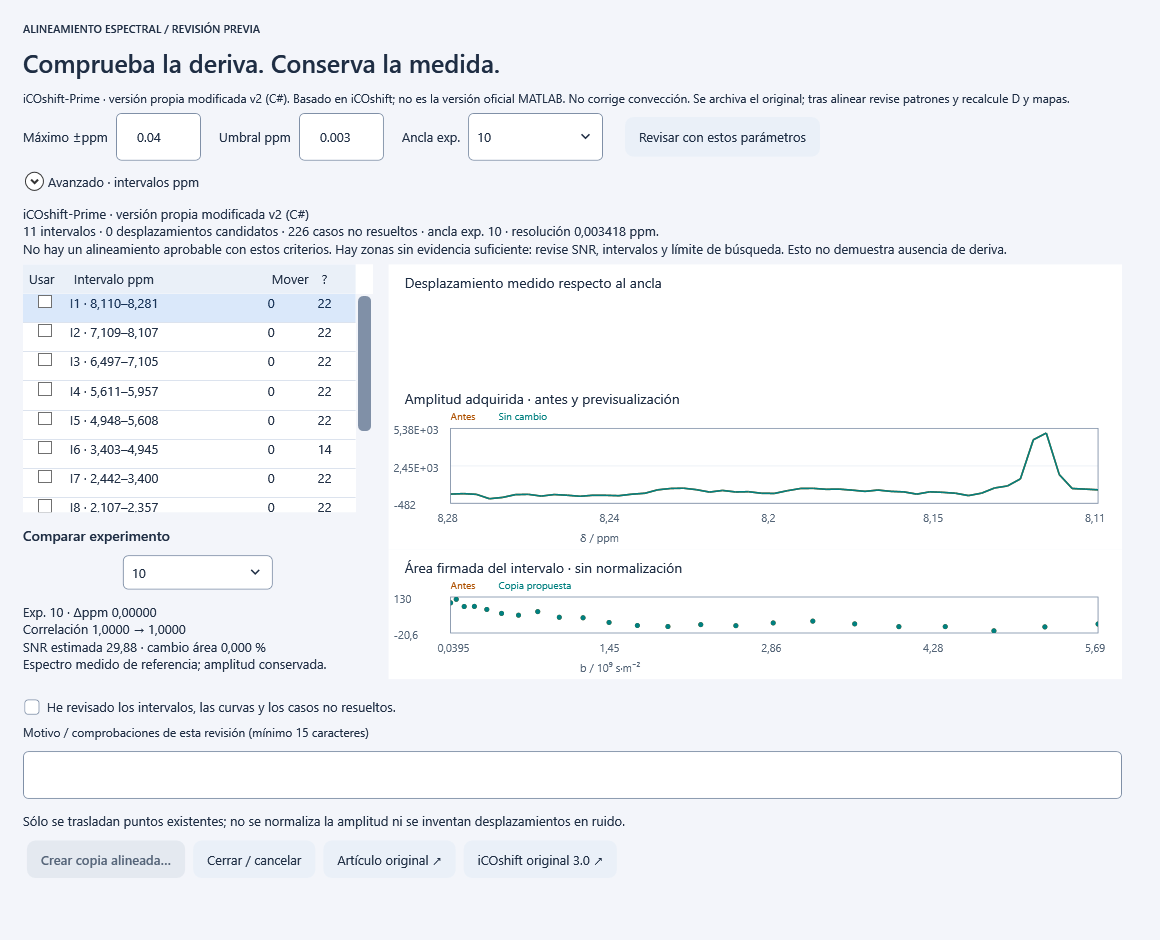
iCOshift-Prime review of the experimental spectra; no alignment applied. Unresolved cases do not mean there is no drift.
You can work without a standard. One or multiple standards require reviewed identity and conditions. Alignment, thermal calibration and convection review are different operations.
BEATRIX
Contextual help follows the peak and band. It offers assignment possibilities and checks, never an assistant-decided chemical identity.
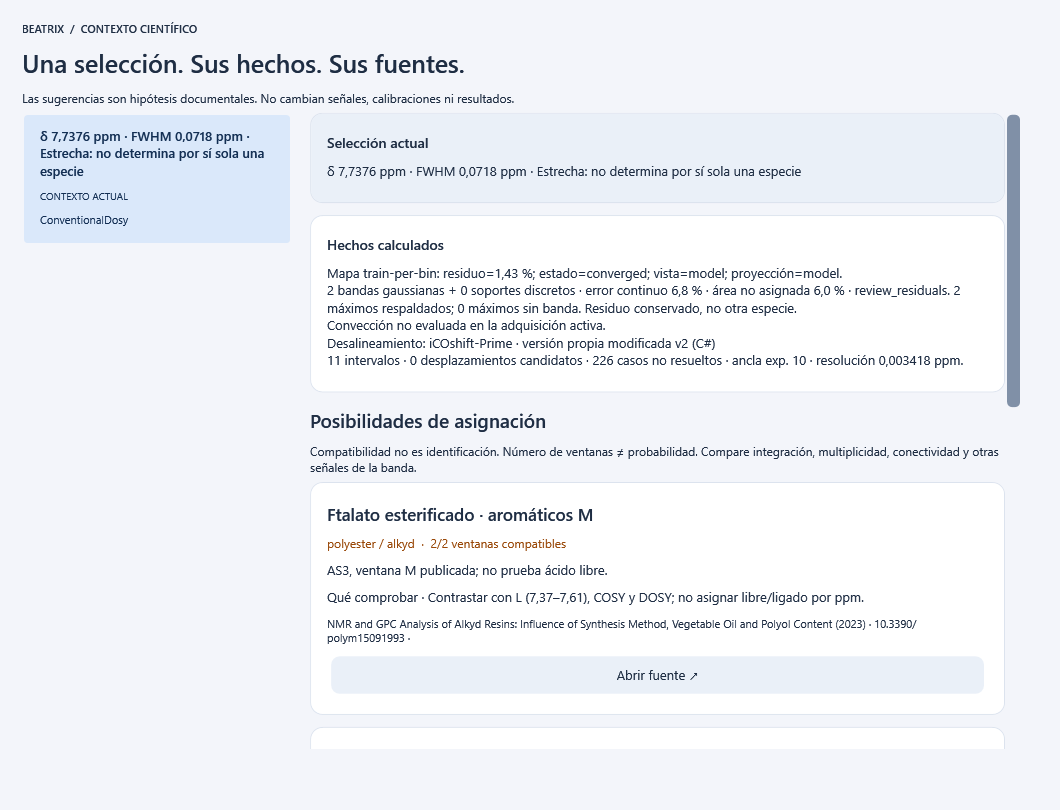
Experimental aromatic region. Documentary suggestions, such as a phthalic fragment, require checking other signals; they are not automatic identifications.
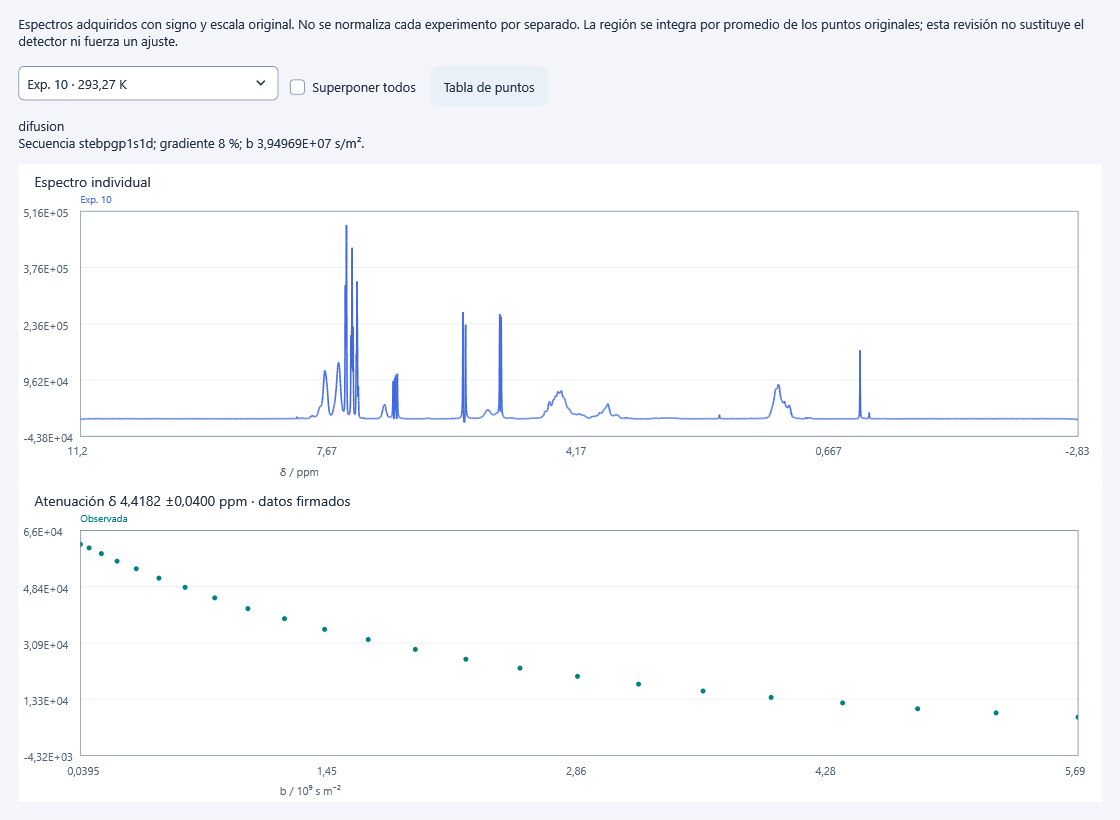
Measured spectra and local region. Common scaling and signal sign are retained; experiments are not individually normalised to match.
ACTUAL FEATURE STATUS
Bruker 1r import, local C# methods, attenuations, standards, temperature, viscosity, maps, linear fits, distributions and export.
High-dilution PS/PPG, shared concentration model and custom curve: apparent mass within their domain. Final convection correction requires an admissible physical review.
Ultrafast D–T₂ example 1502 has exploratory reconstruction and native C# TRAIn2D/FISTA. SPEN-DOSY and UF-DEXSY retain provenance-tracked published packages. SPEN is not yet a native Prime reconstruction; the new ultrafast DOSY sequence remains unvalidated.
SHARED AUDIT
Prime 0.12.5 and ResinAtOnce 0.48.1 include fixes with reproducible regressions: local context after failure or cancellation, physical separation inputs, concentration inversion near its segment change and atomic JSON saving.
The shared core lets you compare local TRAIn and the map on identical inputs. Global-projection bands remain distinct from regional components; no values are forced to make samples or methods agree. Software checks do not replace experimental validation.
How to check and recover a calculation →SOURCES & OPEN DATA
Entries include publications, data, licences and limitations. Prime does not claim authorship of others’ sequences or code.
iCOshift-Prime and dual-Newton MaxEnt are modified in-house implementations. Method references do not imply full equivalence or experimental validation of Prime.
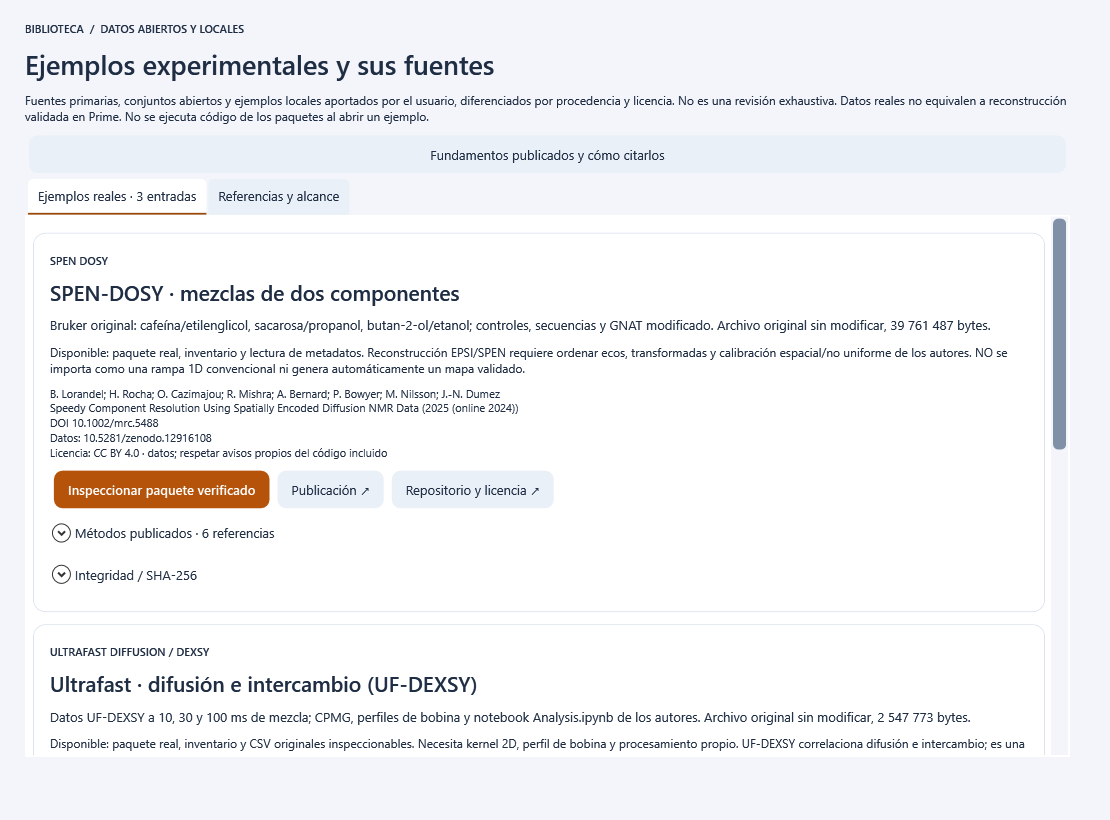
Library of published SPEN-DOSY and UF-DEXSY packages with DOI, licence and hashes, plus local ultrafast D–T₂ example 1502 with code and acquisition contract. Opening the library does not run reconstruction.
EXPERIMENTAL EXAMPLES · R&D
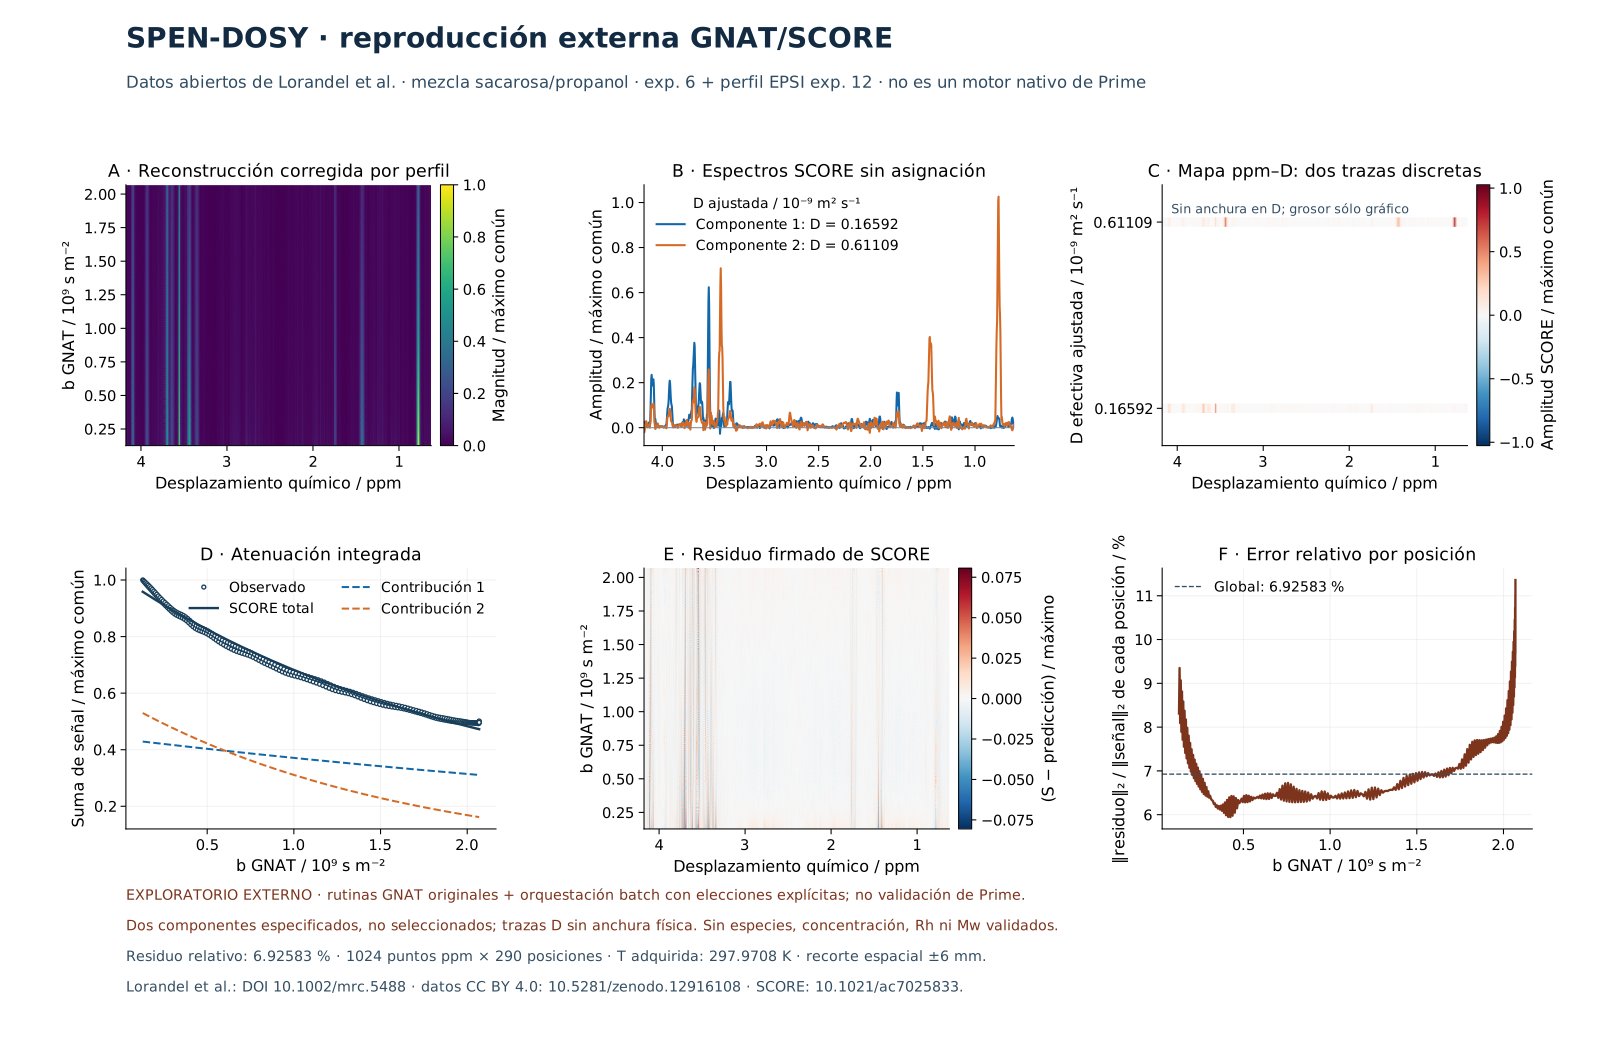
These figures are calculated from experimental data. They are neither mockups nor screenshots: one is an external SPEN reproduction using author tools; the other is a native Prime ultrafast D–T₂ inversion. Assumptions and limitations accompany each result.
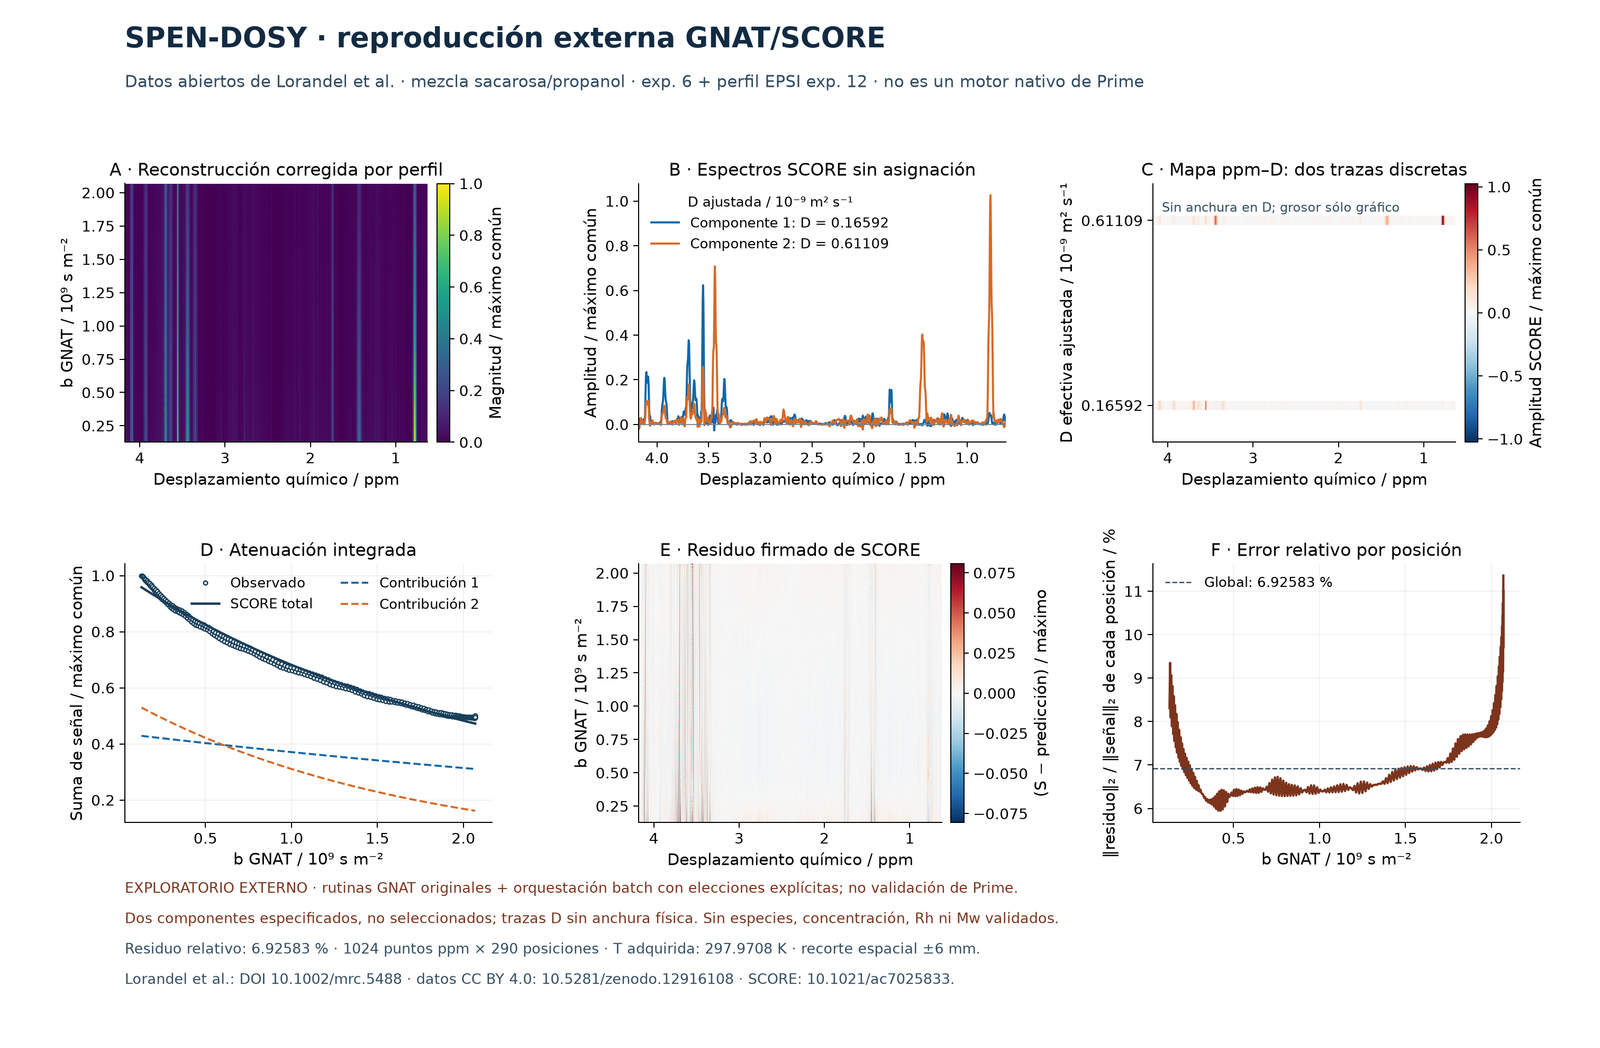
Published sucrose/propanol data: experiment 6 and EPSI reference 12. Batch processing with original author/GNAT functions and explicit window/reconstruction choices; not a native Prime output. Matrix: 1024 ppm × 290 positions. SCORE with two specified components, not automatically determined; relative residual 6.93%.
The map shows two discrete traces without physical width. Fitted D values (1.659 and 6.111 × 10⁻¹⁰ m²/s) are parameters of this reproduction, not confirmed assignments or quantitative Prime validation.
Published antecedent · Published data · Provenance and parameters · SVG
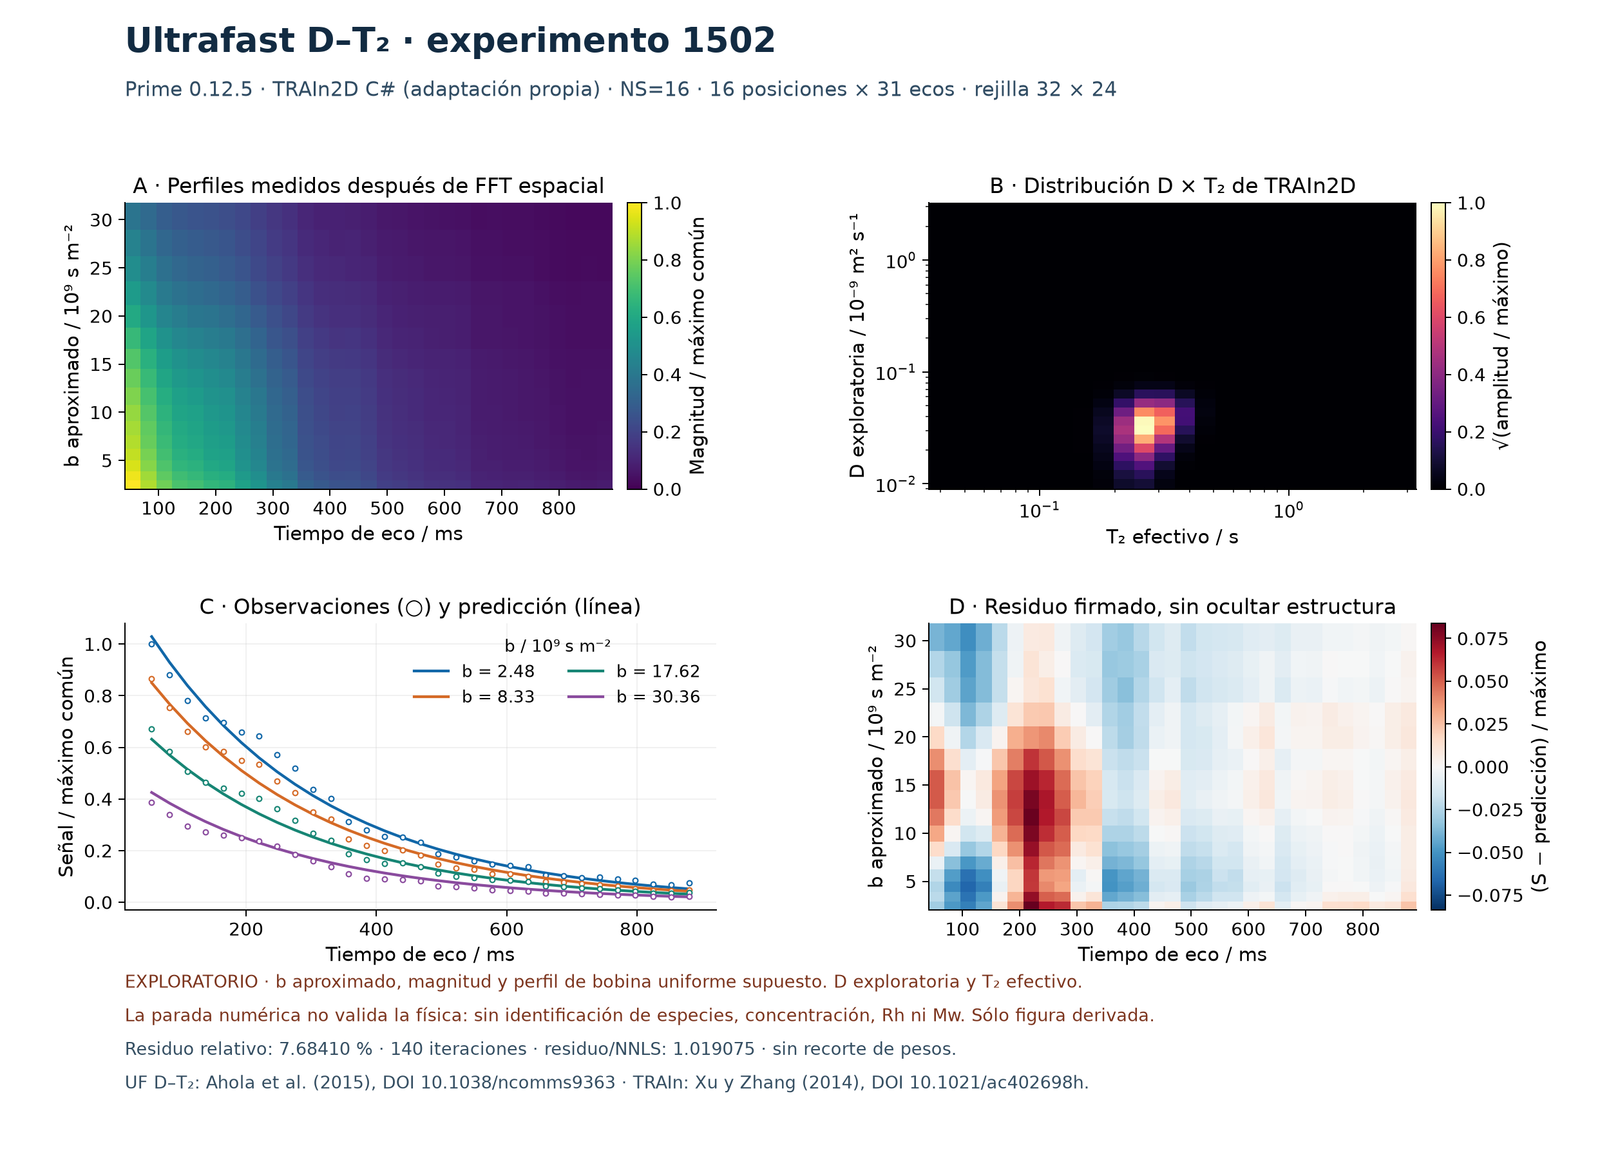
User-supplied experimental example: ¹H/D₂O, 313.0038 K and NS = 16. Profile 16 × 31; D × T₂ grid 32 × 24. C# TRAIn2D: 140 iterations, relative residual 7.68%. The figure represents diffusion and effective T₂, not ppm–D.
No measured coil profile: exploratory spatial window and b. Not single-scan acquisition, calibrated MwOSY, a test of the new DOSY sequence or molecular assignment. Local data are not redistributed from this website.
Published antecedent · Further D–T₂ antecedent · Provenance and parameters · SVG
The SPEN reproduction uses SCORE with two specified components; the method is credited to its original authors. SCORE · Analytical Chemistry.
Figure integrity manifest ↗METHODOLOGICAL ANTECEDENTS
The application distinguishes publications, supplied original implementations and C# adaptations. Local train2d.py retains its provenance; no DOI of its own or exact equivalence to all these methods is claimed.
These references document antecedents; they do not certify the implementation, example 1502’s exploratory scale or the user’s new sequence.
ABOUT THESE SCREENSHOTS
Prime 0.12.5 screenshots show TP194, ¹H/CDCl₃, a 23-experiment ramp. An in-memory copy of the saved project was opened and the 4.4182 ± 0.04 ppm region calculated in the application. Original data and source project remain unchanged. Only the display name was shortened and the local presentation path removed. Curves were not retouched.
The project retains its calibration: TTMS applied, thermal normalisation disabled (fT = 1), η estimated at 293 K. The MwOSY view uses PS only to illustrate the transformation. The first acquisition’s title has no weighings; no invented concentration is used.
These views do not prove chemical identity, component concentration, absolute masses or absence of convection. The example screenshot shows the library; derived research figures state their own provenance and limits separately. The ResinAtOnce 0.48.1 guide uses clearly labelled DEMO, not experimental data.
Public screenshot record and hashes ↗Search for a task and learn with screenshots.
02 / FAQAnswers about calculation, models and use.
WATCH, PAUSE, REPEAT
Six workflows with separately narrated Spanish and English movies, in the application and on the web. Page language selects the voice, interface and timeline; CC offers ES/EN captions. Chapters and downloadable steps. No autoplay or external providers.
DIFFATONCE / MOLECULAR DIFFUSION