Retain the template
Create a parameter-only copy, for example 1050 from experiment 1000. Existing destinations are rejected and originals are retained.
DIFFATONCE / SPECTROMETER CALIBRATION · 1.0
Prepare the instrument, fit the 90° pulse and calibrate the DOSY scale through a TopSpin interface. Review every step while retaining original templates and data.
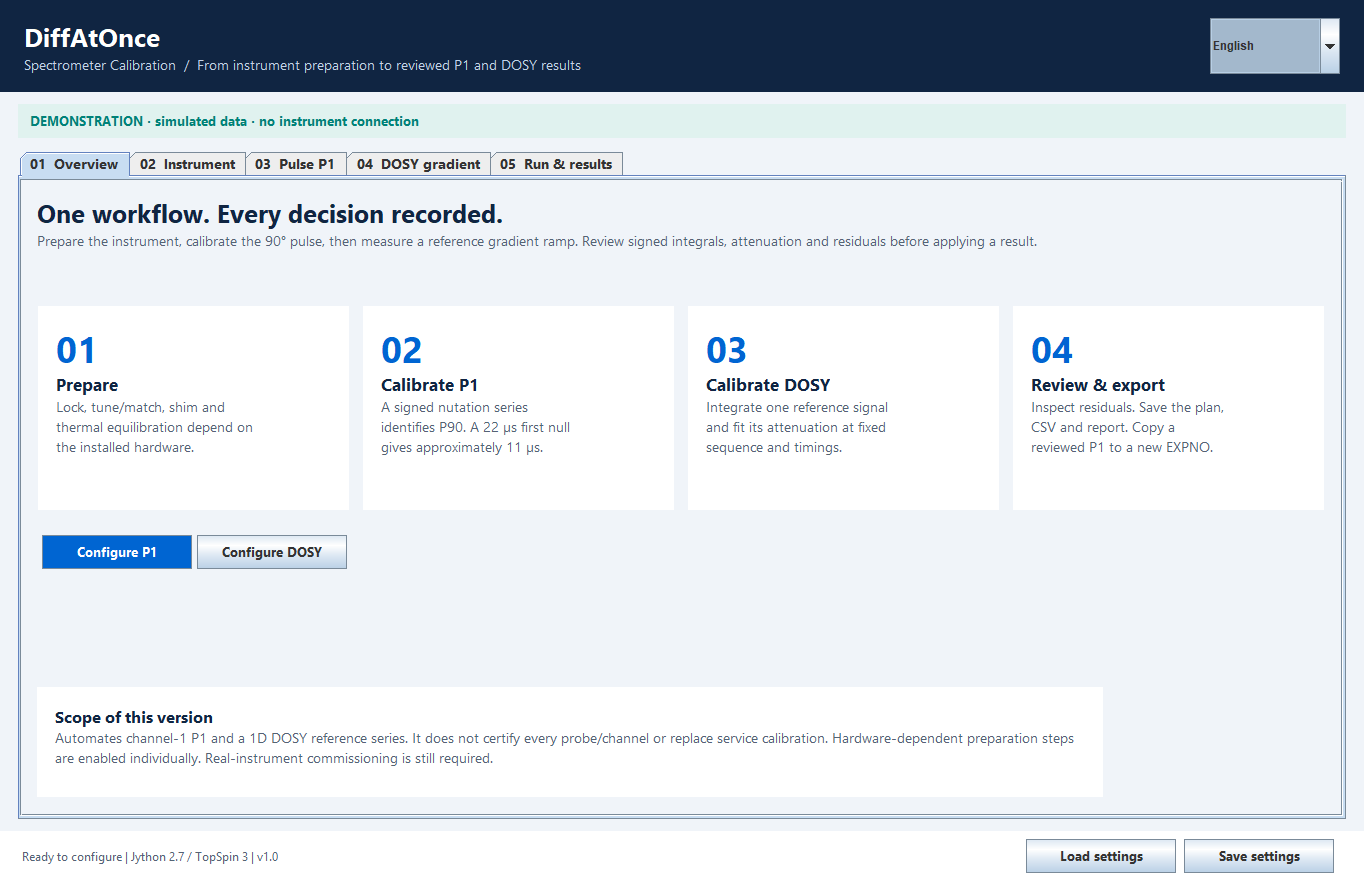
Five tabs, a language selector and controls for reviewing context before execution.
01 / PREPARATION
First confirm the context: sample, probe, solvent, channel, power and temperature.
Create a parameter-only copy, for example 1050 from experiment 1000. Existing destinations are rejected and originals are retained.
Enable LOCK, ATMA tuning and matching, and TOPSHIM separately according to hardware and configuration. Review lock and line shape after execution.
Query the controller and set the temperature demand within explicit limits. Allow the sample to equilibrate: stored TE does not establish its actual temperature.
02 / 90° PULSE
Start from experiment 1000 with a reviewed zg template. Vary P1 while retaining RF power, RG, NS, D1 and phase. Integrate the same isolated signal throughout the series.
The curve should include a positive maximum, first null and negative signal. Review the fit and residuals before applying P1 to a new EXPNO.
Read the complete procedure ↗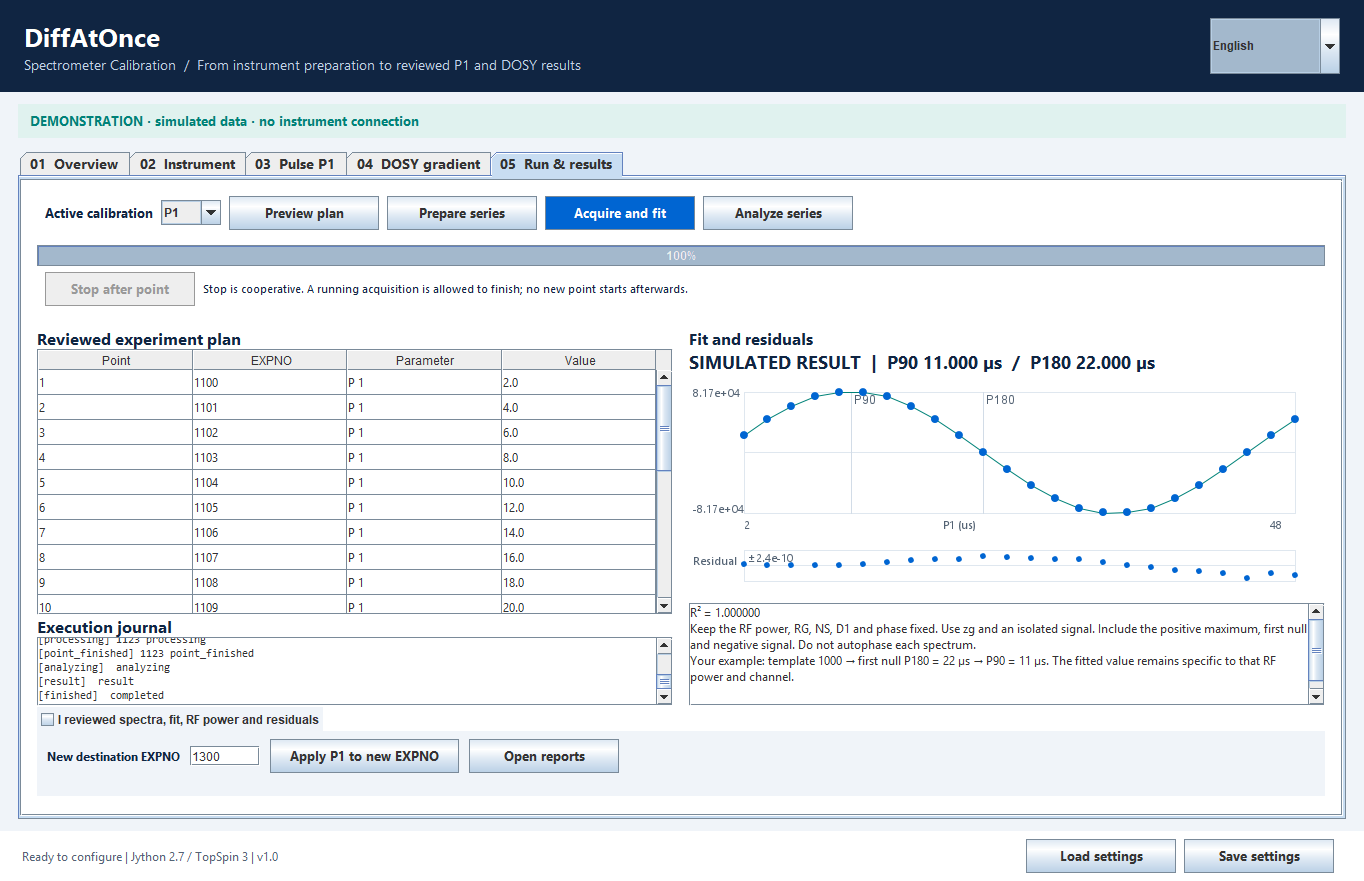
Simulated example: first 180° null at 22 µs and fitted P90 of 11 µs. The result depends on the channel and power used.
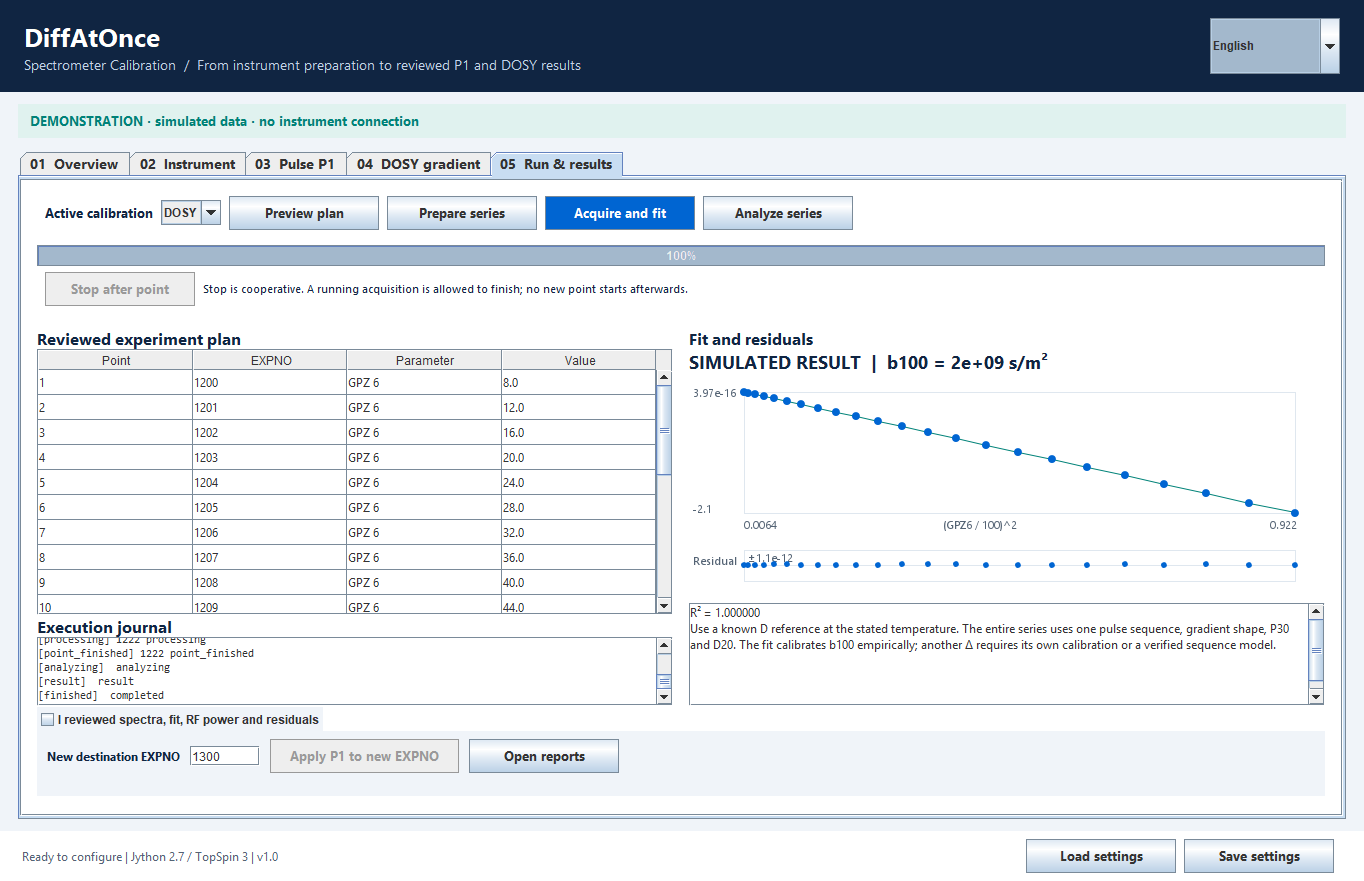
Simulated ramp and fit with Dref = 1.15 × 10⁻⁹ m²/s and b100 = 2 × 10⁹ s/m². These are demonstration values.
03 / DOSY CALIBRATION
Select the integration region, reference D, its temperature and its source. The series retains the pulse sequence, gradient shape and diffusion timings.
The fit uses positive signal integrals with common phase. Changing Δ, δ or the sequence requires another calibration or a verified model. The GUI prepares one diffusion condition per series.
The DOSY profile is saved for review. The spectrometer’s global calibration is not overwritten.
IN THE TOPSPIN COMMAND LINE
Copy the self-contained script into your installation’s user-script folder, following your laboratory procedure.
<TopSpin>/exp/stan/nmr/py/user/xpy spectrometer_calibration_gui.pyRequires the TopSpin Java/Jython environment with TopCmds and Swing. The demonstration uses run_demo.ps1 and an existing local runtime; it installs no dependencies.
Check communication from the GUI and verify the starting context. Opening the window starts no acquisition.
Configure templates, parameters, ramps and unused destinations. Prepare series creates parameters only; Acquire and fit runs ZG/EFP.
Inspect signals, fit and residuals. Retain JSON, CSV, journals and the DOSY HTML report. Analyze series uses already available spectra.
SOFTWARE + DOCUMENTATION
Version 1.0 · 3 October 2026.
The package includes the interface, manuals and demonstration.
Self-contained TopSpin script, source code, configuration, tests and bilingual documentation.
Download package ↓28 pages with interface images, instrument preparation, a P1 example, DOSY calibration and troubleshooting.
Open ES manual ↗The same complete practical guide in English, with controls and interface images in that language.
Open EN manual ↗SCOPE AND VERIFICATION
51 cases pass in Jython 2.7.2. CPython passes 41 and skips 10 Java-specific cases. Simulated API: copies, preservation, collisions, signs, fitting and stopping between points.
Launch and a CURDATA read were confirmed in the source GUI through CmdThread. The check issued no hardware commands, parameter writes or acquisitions.
Prepared for the requested workflow; real acquisition and complete compatibility remain to be checked on the target instrument. Review commands, return status, probe, power and experimental quality.
Scope: guided preparation, channel-1 P1 and standard-based DOSY scale. This does not include T1, other channels, service calibration or validation of actual sample temperature. Images on this page are renders of the real Swing interface with simulated data.
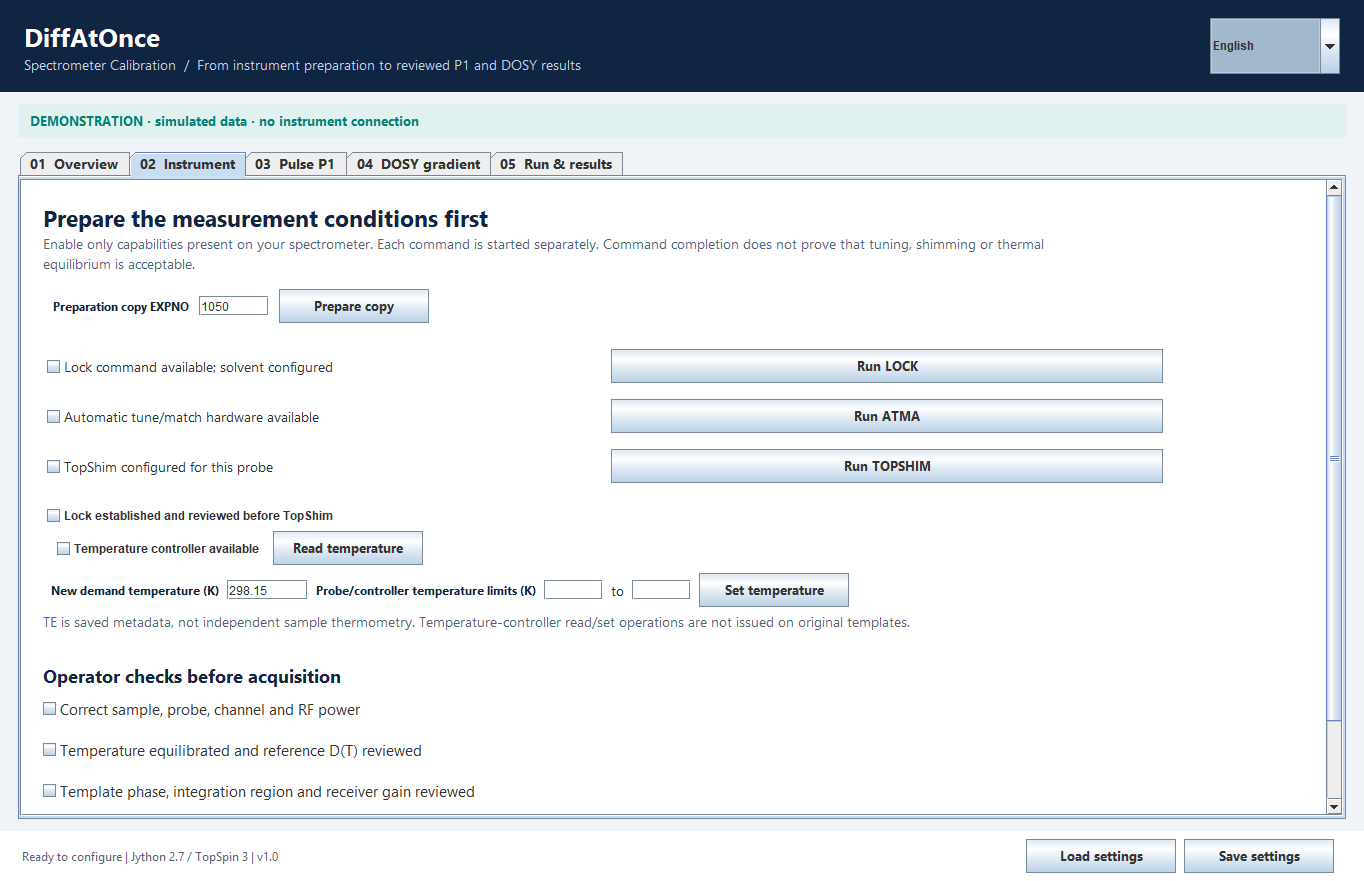
Working copy, instrument capabilities and operator checks. Scroll through the tab to review every control.
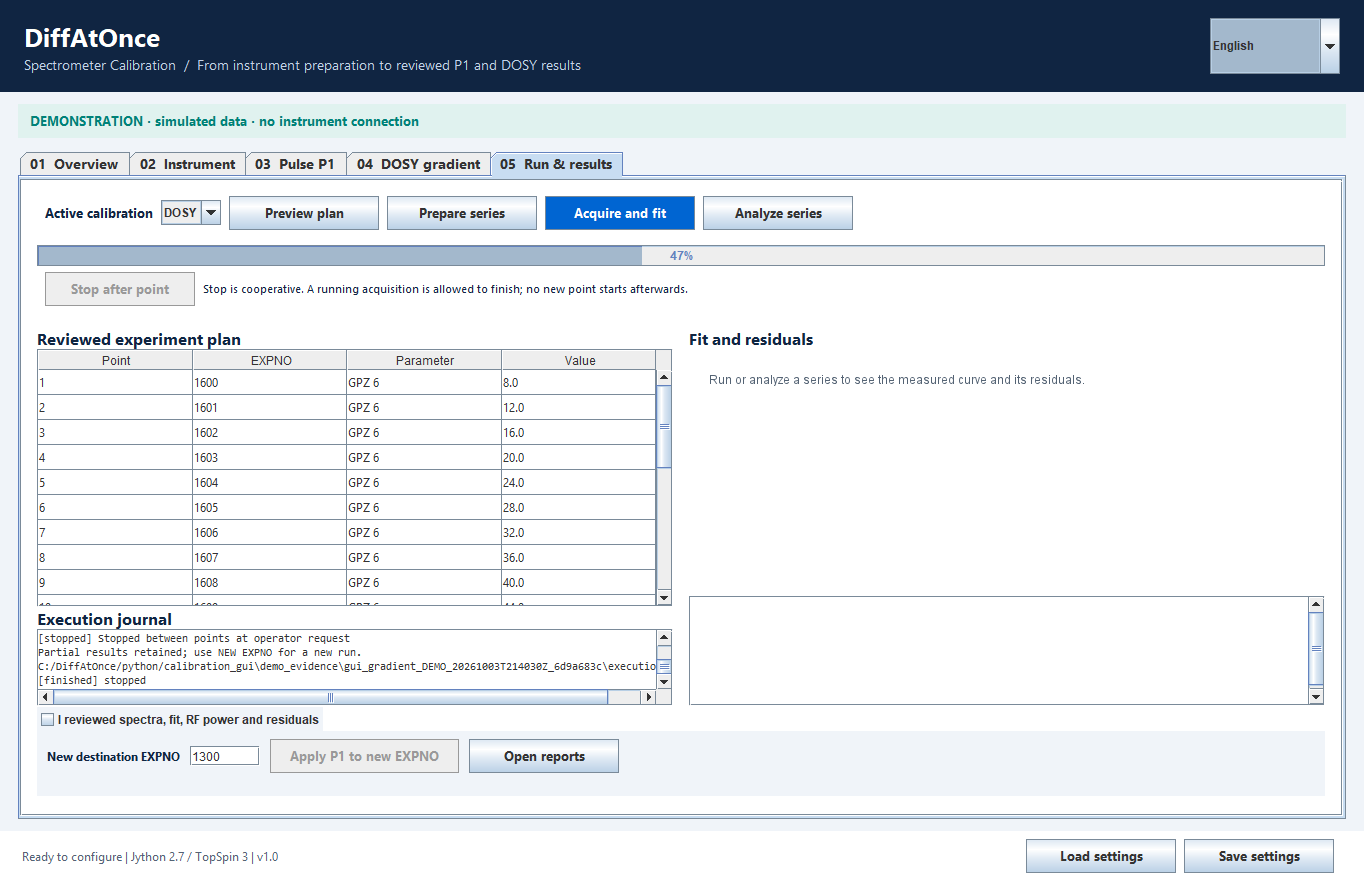
A requested stop lets acquisition and processing of the current point finish before stopping the series.
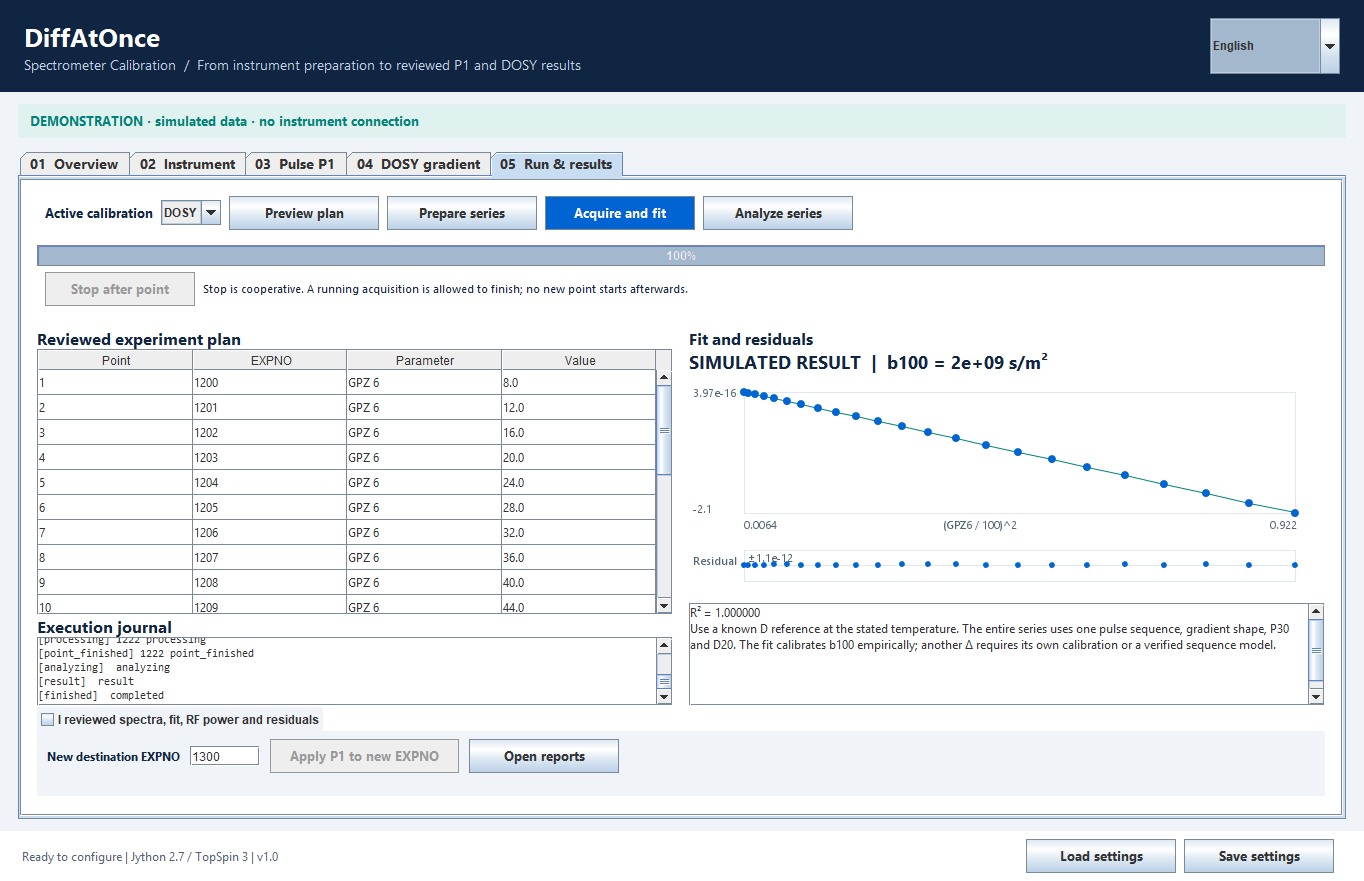
Open the report folder from the result. Demonstration files retain their simulation identity.
PRACTICAL QUESTIONS
The manual brings together fields, examples and review criteria for every step.
Only when that P1 is the first 180° null in an appropriate zg series. A 360° null is divided by four. The value is specific to channel and power; retain sign and phase when locating it.
This calibration GUI uses one template diffusion condition per series. To change Δ, prepare another series and verify its b scale. The three-ramp generator is a separate tool.
It is a cooperative stop: the running ZG/EFP point finishes and the next point is not started. It is not an immediate RF-abort button.
After result review, a new EXPNO receives a parameter-only copy with updated P1. Power and, when recorded, nucleus and probe are checked. The action acquires no data and retains the original.
DIFFATONCE / MOLECULAR DIFFUSION